MANUFACTURING · CHEMICALS · INDUSTRIAL PARKS
Cheaper, cleaner energy. Without stopping the line.
Loop makes every kilowatt-hour in your plant traceable, finds the improvements with the fastest payback and keeps power flowing when the grid doesn't.

AMMONIA TODAY
26.0
t
Forecast 41.6 t · 69% of nameplate
GREEN SHARE TODAY
80
%
Target 85%
GRID RIGHT NOW
−9.7
MW
Exporting surplus solar
CO₂ PER TONNE NH₃
0.85
t
Grey ammonia ≈ 2.4 t
Live from the Map Ta Phut Green Ammonia demo plant · 60 MWp solar · 24 × 1 MW AEM electrolysers · Haber-Bosch 60 t NH₃/day
WHAT'S AT STAKE
Energy decides your margin, your right to sell and your uptime.
01
Energy is a margin wrecker, or a line item you control.
Energy is one of your biggest variable costs, yet it is metered per site at best. Without data per process and per shift, you can't tell what drives the bill or what to fix first.
02
Decarbonisation rules are tightening. Do you have the data?
CBAM declarations and customer supply-chain audits ask for emissions per tonne of product. Collecting that by hand from separate systems is slow and hard to defend.
03
Outages ruin flow and economics. Most are predictable.
A tripped unit or a grid dip stops a line and spoils a batch. The warning signs are usually in the data days before. If the system is being monitored.
UNDERSTAND IT
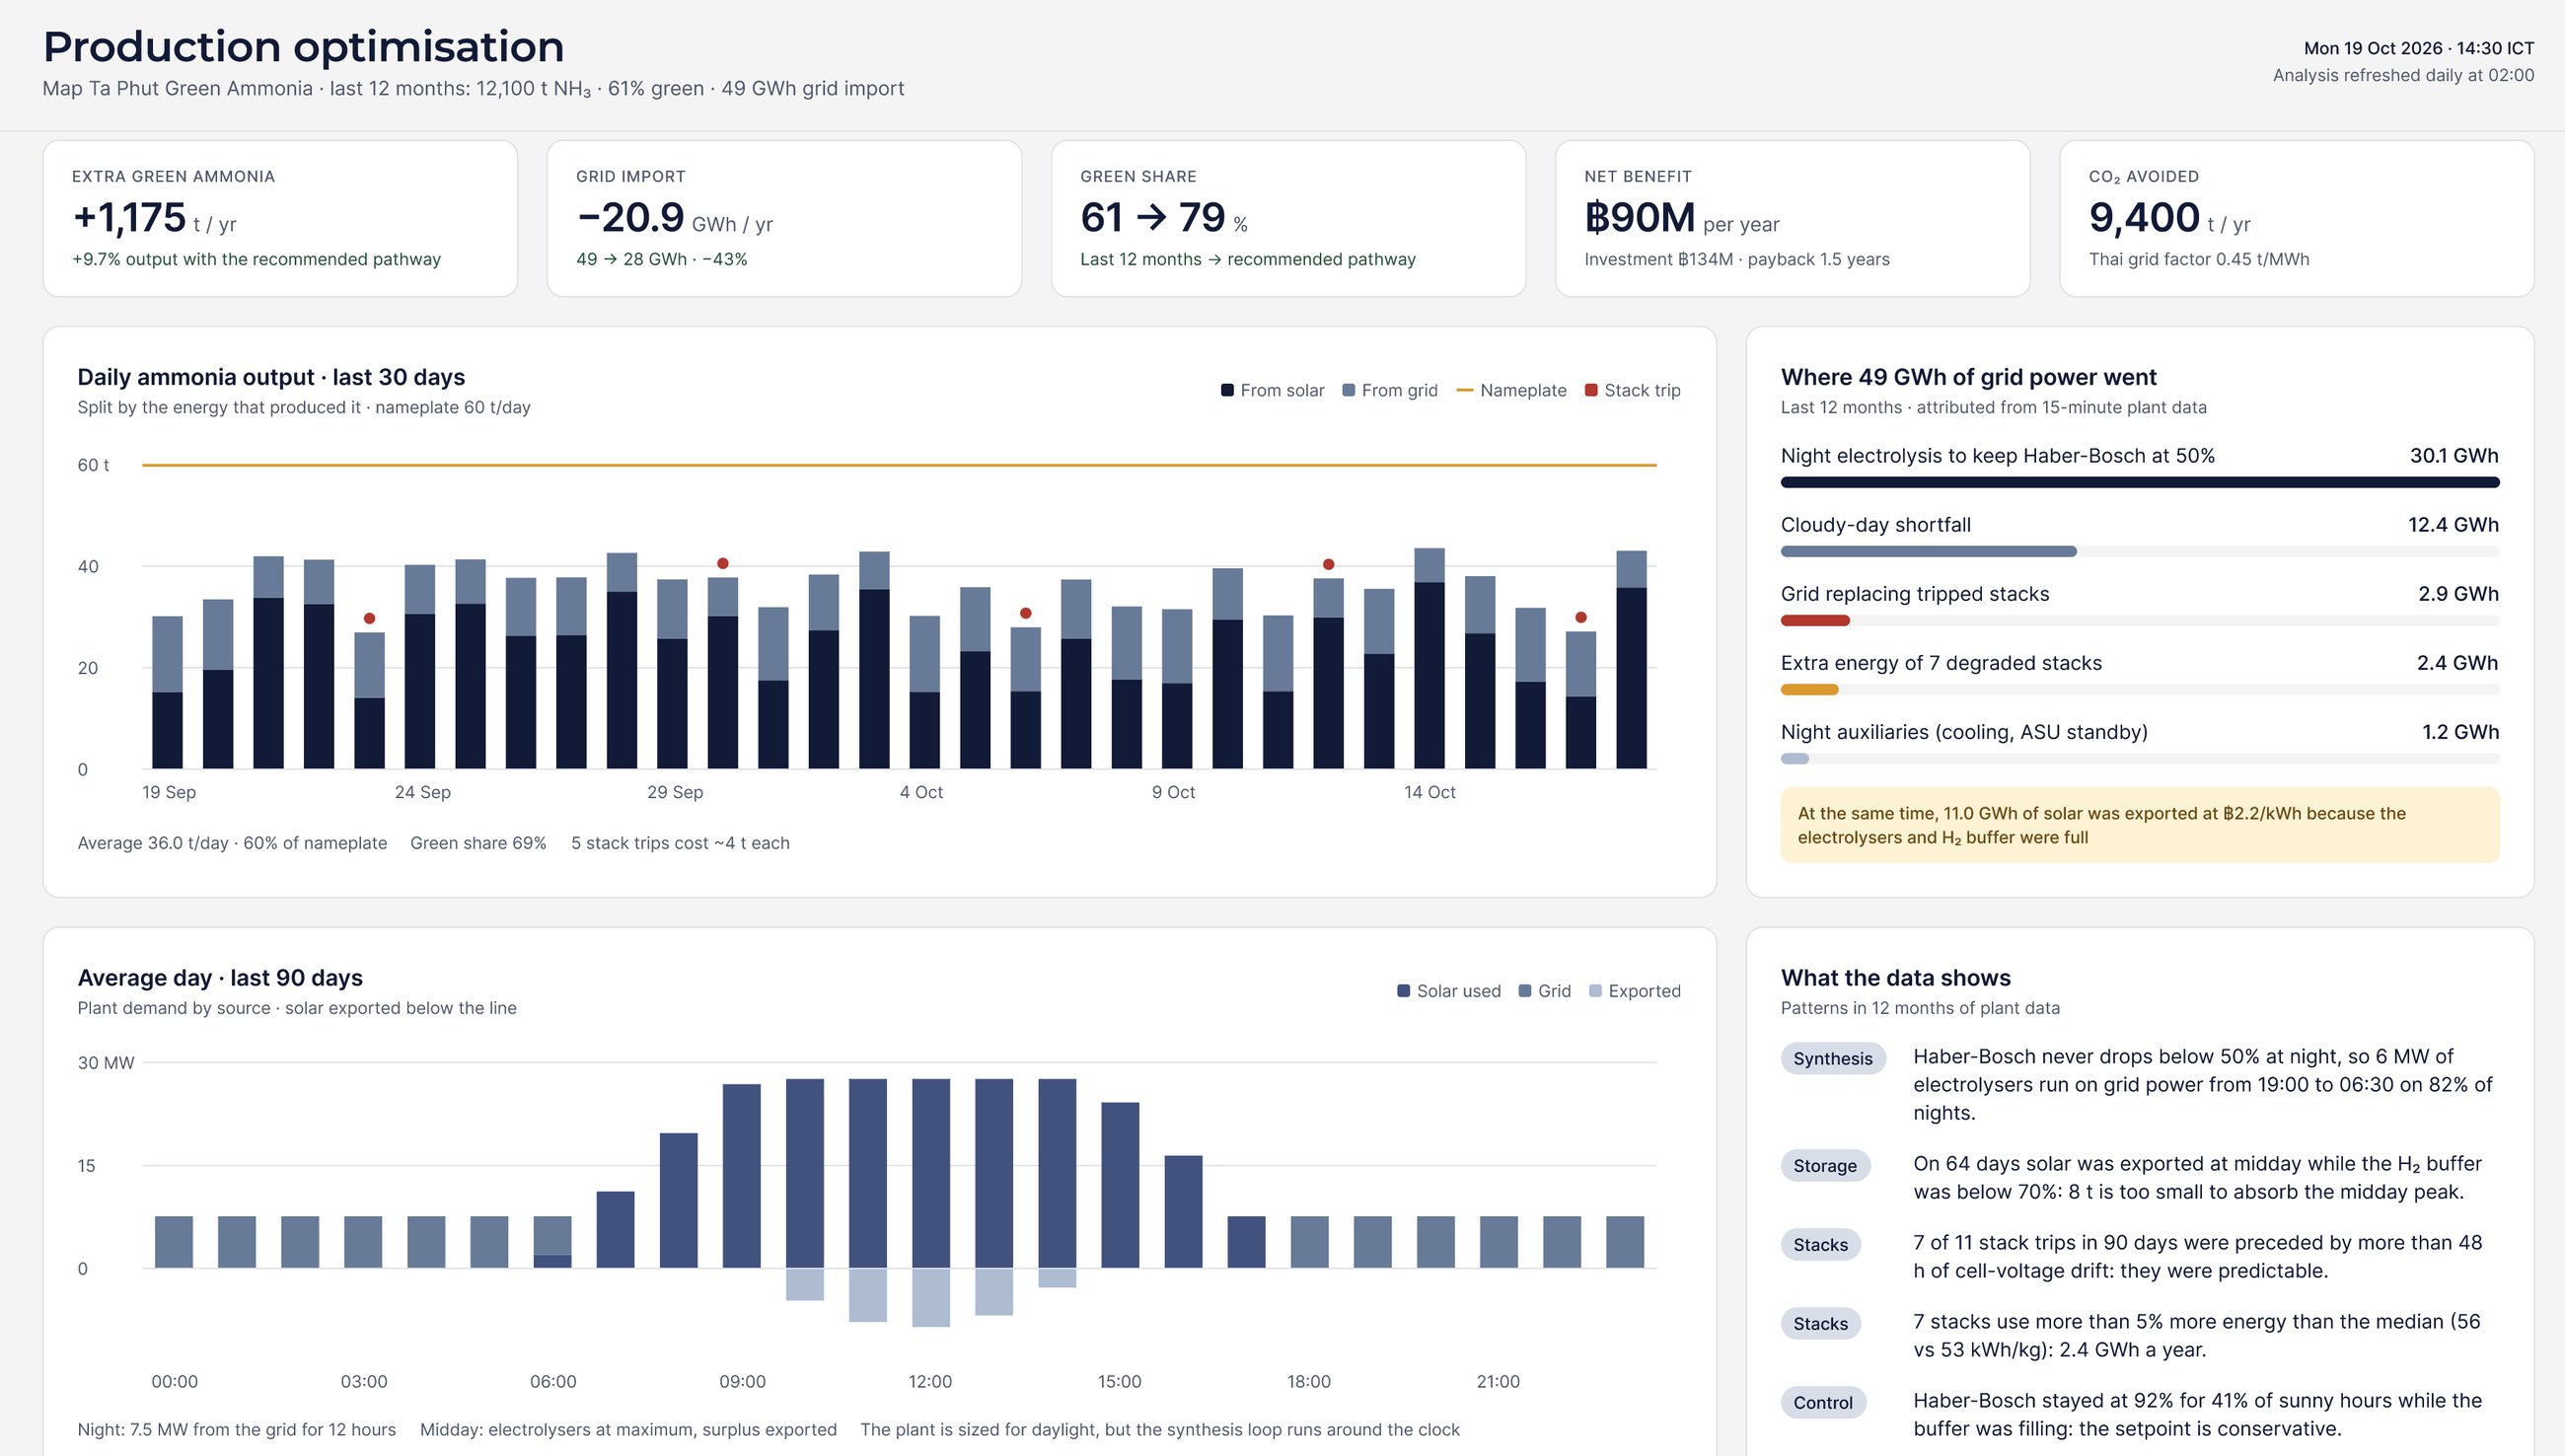
49 GWh from the grid. 30 GWh of it just kept synthesis running overnight.
Loop attributes every kilowatt-hour to the process that used it, at 15-minute resolution. You see exactly why the plant is less green and less profitable than it was designed to be.
11.0 GWh
of solar exported at ฿2.2/kWh in the same year, because the electrolysers and H₂ buffer were full.
SEE IT
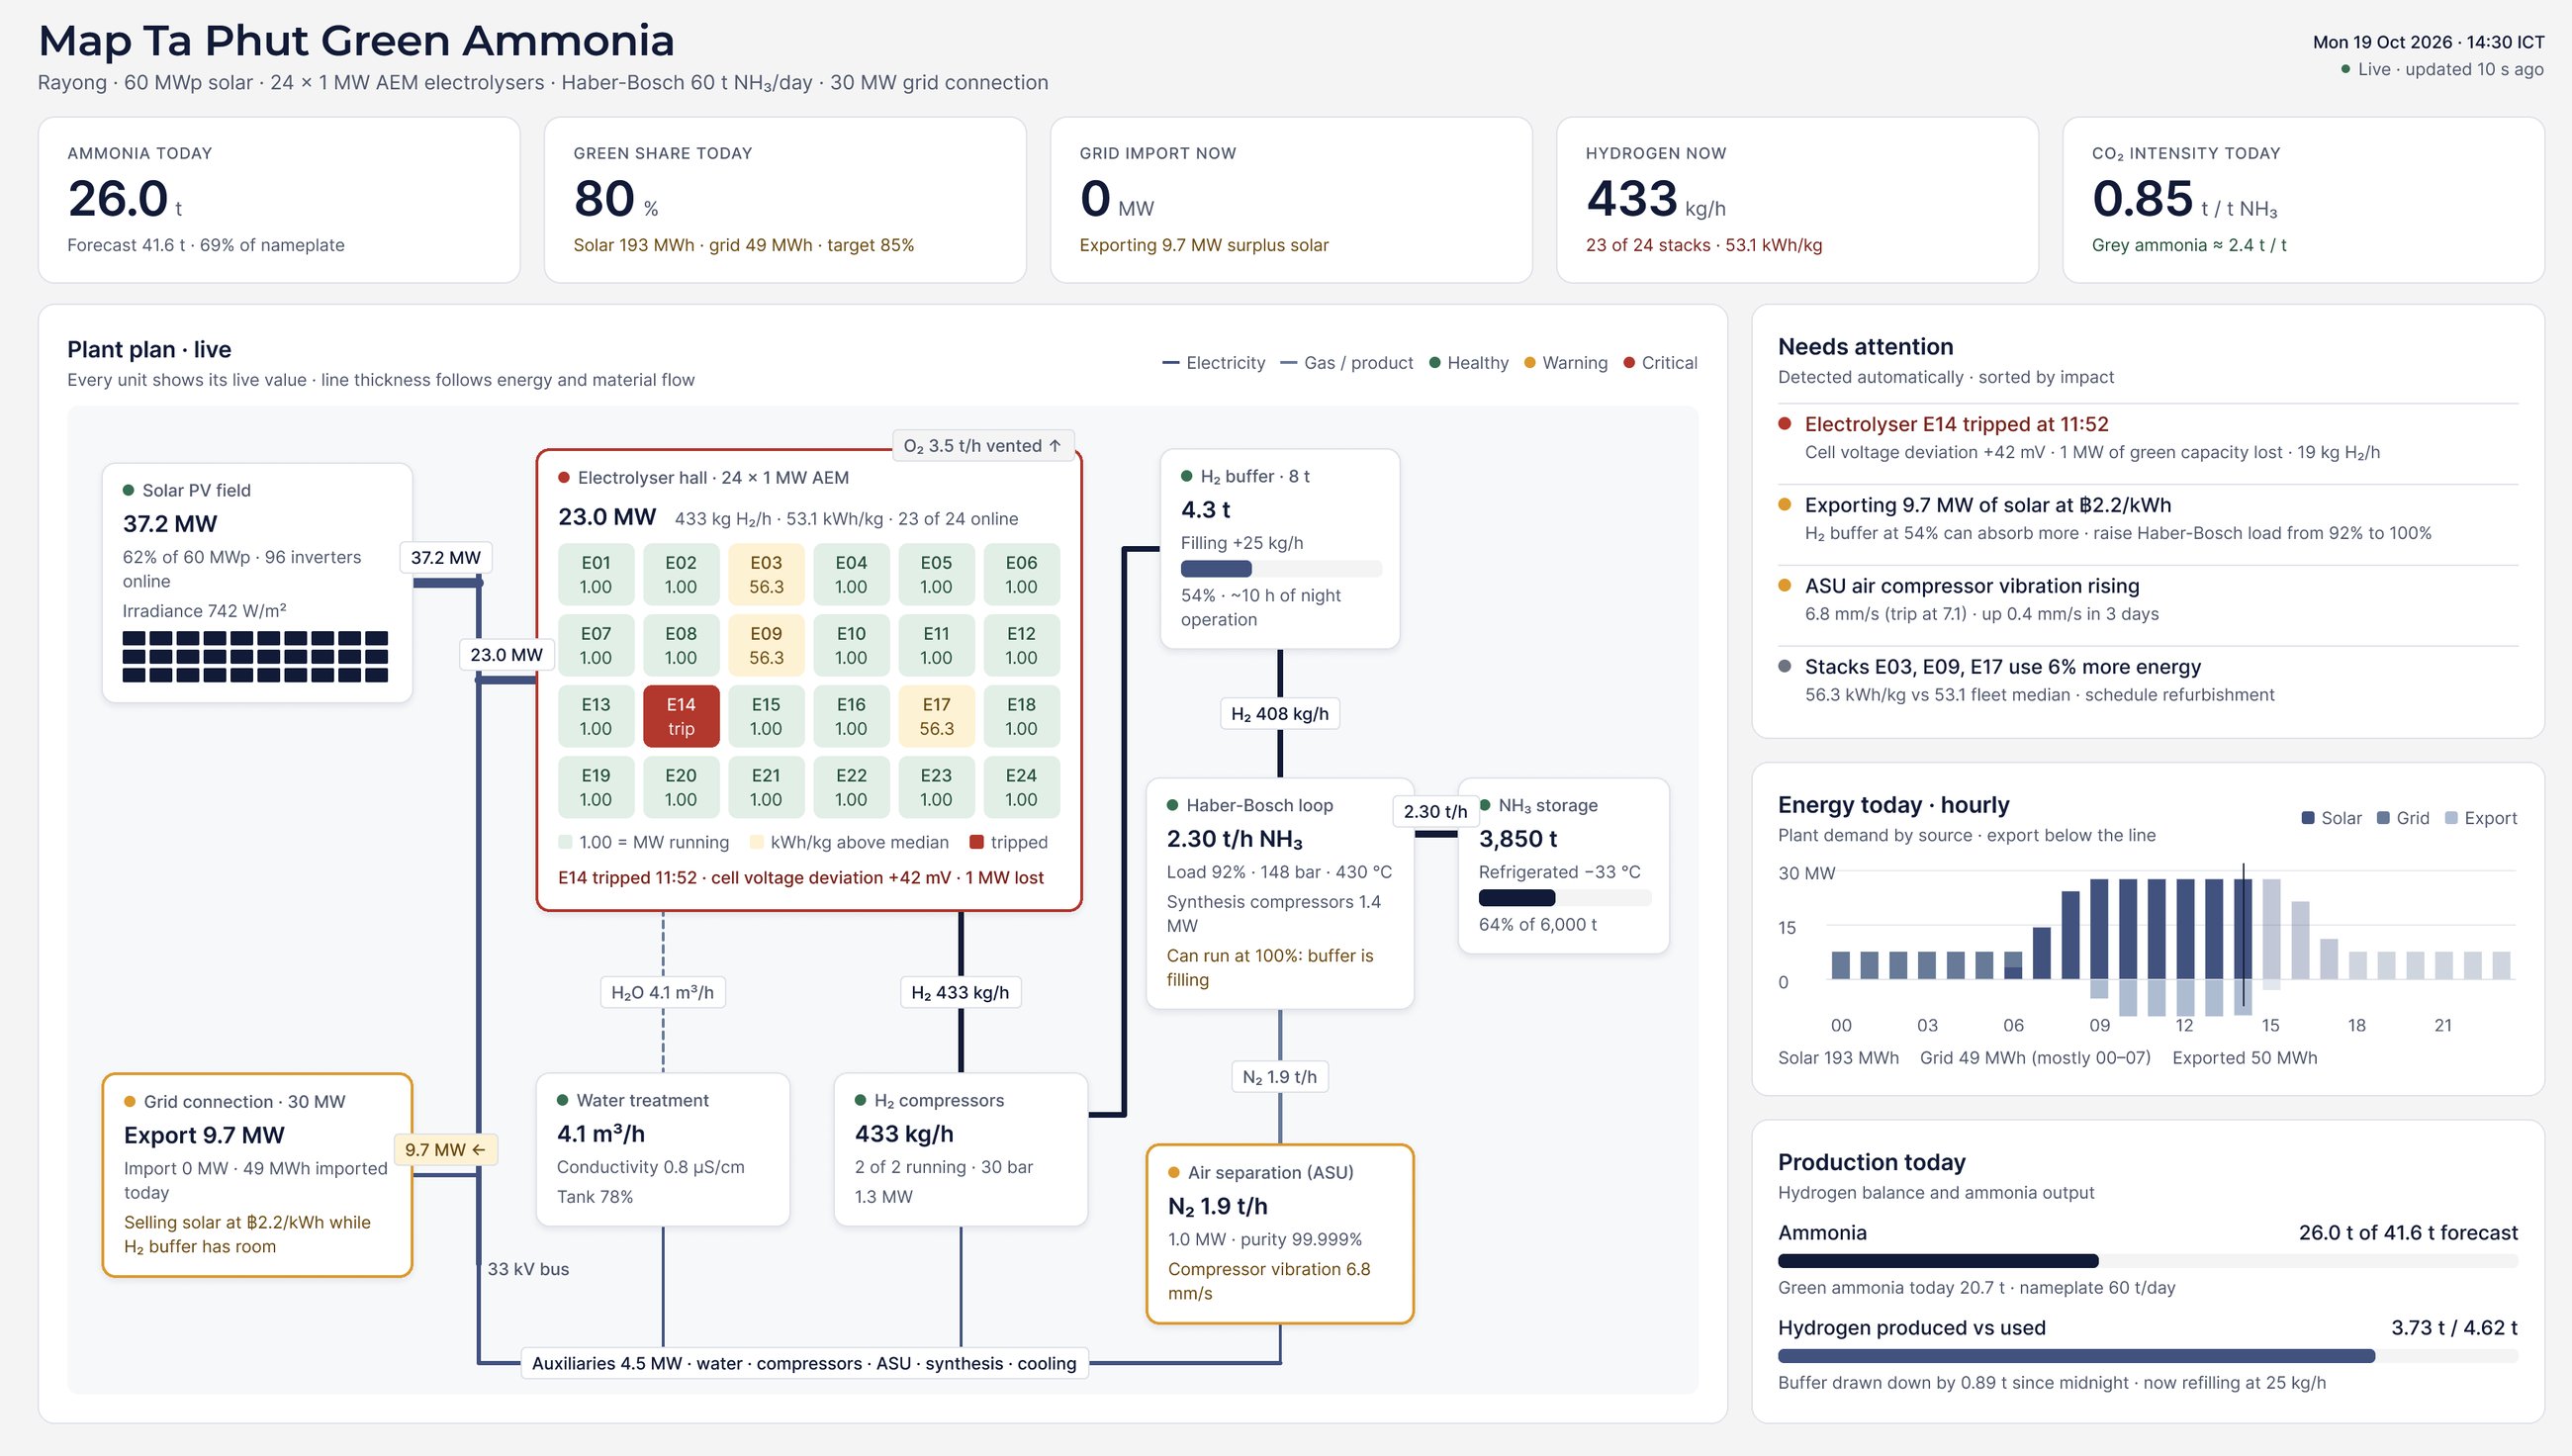
The whole plant on one screen, down to each stack
Every unit shows its live value, and problems come to you before an operator goes looking.
1
2
3
4
01
Stack trip, caught in seconds
E14 tripped at 11:52 on a cell-voltage deviation. 1 MW of green capacity is flagged before anyone opens a log.
02
Surplus sold too cheap
9.7 MW exported at ฿2.2/kWh while the H₂ buffer still had room to store it.
03
Room to increase production
The buffer is filling, so the Haber-Bosch loop can safely run at 100%.
04
A failure on its way
Air-compressor vibration rose 0.4 mm/s in 3 days, now close to its 7.1 mm/s trip limit.
DECIDE IT
Evaluate options based on data and potential future outcomes
Loop simulates each option based on data from your own devices, making truly data-driven decisions possible
Today
Baseload synthesis 50–92% · electrolysers on grid at night
A · Follow the sun
Flexible synthesis 25–100% · no grid electrolysis at night
B · Hybrid
Recommended
Flexible synthesis + 20 t H₂ buffer + stack maintenance
C · Maximum output
Baseload 100% + 6 MW more electrolysers
12,100
t NH₃ / yr
Baseline
Green ammonia
Grid-based ammonia
GREEN SHARE
61%
GRID IMPORT
49 GWh
INVESTMENT
—
VERDICT
Where you are today
REPORT IT
Compliance data that collects itself
CO₂ PER TONNE OF AMMONIA
0.85 t
vs ≈ 2.4 t for grey ammonia, traced hour by hour

CBAM declarations
Embedded emissions per tonne of product, calculated from metered data and ready for your EU importers.
Scope 1 & 2 and customer audits
Energy and emissions per site, line and product for ESG reports and supply-chain questionnaires.
Green product certification
Hourly matching of renewable power to production: the evidence green hydrogen and ammonia schemes ask for.
Find the fastest payback in your plant
Book a demo

Legal Notice · Privacy Policy

Book a demo

PLATFORM
Gateway Software
Dashboards
Fleet Management
Opportunity Identifier
Optimisation Engine
SOLUTIONS
Renewable Installers
Commercial Buildings
Industry
Home Owners
About us
Book a demo
MANUFACTURING · CHEMICALS · INDUSTRIAL PARKS
Cheaper, cleaner energy. Without stopping the line.
Loop makes every kilowatt-hour in your plant traceable, finds the improvements with the fastest payback and keeps power flowing when the grid doesn't.
AMMONIA TODAY
26.0
t
Forecast 41.6 t · 69% of nameplate
GREEN SHARE TODAY
80
%
Target 85%
GRID RIGHT NOW
−9.7
MW
Exporting surplus solar
CO₂ PER TONNE NH₃
0.85
t
Grey ammonia ≈ 2.4 t
Live from the Map Ta Phut Green Ammonia demo plant · 60 MWp solar · 24 × 1 MW AEM electrolysers · Haber-Bosch 60 t NH₃/day
WHAT'S AT STAKE
Energy decides your margin, your right to sell and your uptime.
01
Energy is a margin wrecker, or a line item you control.
Energy is one of your biggest variable costs, yet it is metered per site at best. Without data per process and per shift, you can't tell what drives the bill or what to fix first.
02
Decarbonisation rules are tightening. Do you have the data?
CBAM declarations and customer supply-chain audits ask for emissions per tonne of product. Collecting that by hand from separate systems is slow and hard to defend.
03
Outages ruin flow and economics. Most are predictable.
A tripped unit or a grid dip stops a line and spoils a batch. The warning signs are usually in the data days before. If the system is being monitored.
UNDERSTAND IT
49 GWh from the grid. 30 GWh of it just kept synthesis running overnight.
Loop attributes every kilowatt-hour to the process that used it, at 15-minute resolution. You see exactly why the plant is less green and less profitable than it was designed to be.
11.0 GWh
of solar exported at ฿2.2/kWh in the same year, because the electrolysers and H₂ buffer were full.
SEE IT
The whole plant on one screen, down to each stack
Every unit shows its live value, and problems come to you before an operator goes looking.
1
2
3
4
01
Stack trip, caught in seconds
E14 tripped at 11:52 on a cell-voltage deviation. 1 MW of green capacity is flagged before anyone opens a log.
02
Surplus sold too cheap
9.7 MW exported at ฿2.2/kWh while the H₂ buffer still had room to store it.
03
Room to increase production
The buffer is filling, so the Haber-Bosch loop can safely run at 100%.
04
A failure on its way
Air-compressor vibration rose 0.4 mm/s in 3 days, now close to its 7.1 mm/s trip limit.
DECIDE IT
Evaluate options based on data and potential future outcomes
Loop simulates each option based on data from your own devices, making truly data-driven decisions possible
Today
Baseload synthesis 50–92% · electrolysers on grid at night
A · Follow the sun
Flexible synthesis 25–100% · no grid electrolysis at night
B · Hybrid
Recommended
Flexible synthesis + 20 t H₂ buffer + stack maintenance
C · Maximum output
Baseload 100% + 6 MW more electrolysers
12,100
t NH₃ / yr
Baseline
Green ammonia
Grid-based ammonia
GREEN SHARE
61%
GRID IMPORT
49 GWh
INVESTMENT
—
VERDICT
Where you are today
REPORT IT
Compliance data that collects itself
CO₂ PER TONNE OF AMMONIA
0.85 t
vs ≈ 2.4 t for grey ammonia, traced hour by hour
CBAM declarations
Embedded emissions per tonne of product, calculated from metered data and ready for your EU importers.
Scope 1 & 2 and customer audits
Energy and emissions per site, line and product for ESG reports and supply-chain questionnaires.
Green product certification
Hourly matching of renewable power to production: the evidence green hydrogen and ammonia schemes ask for.
Find the fastest payback in your plant
Book a demo
Legal Notice · Privacy Policy
Book a demo
PLATFORM
Gateway Software
Dashboards
Fleet Management
Opportunity Identifier
Optimisation Engine
SOLUTIONS
Renewable Installers
Commercial Buildings
Industry
Home Owners
About us
Book a demo
MANUFACTURING · CHEMICALS · INDUSTRIAL PARKS
Cheaper, cleaner energy. Without stopping the line.
Loop makes every kilowatt-hour in your plant traceable, finds the improvements with the fastest payback and keeps power flowing when the grid doesn't.
AMMONIA TODAY
26.0
t
Forecast 41.6 t · 69% of nameplate
GREEN SHARE TODAY
80
%
Target 85%
GRID RIGHT NOW
−9.7
MW
Exporting surplus solar
CO₂ PER TONNE NH₃
0.85
t
Grey ammonia ≈ 2.4 t
Live from the Map Ta Phut Green Ammonia demo plant · 60 MWp solar · 24 × 1 MW AEM electrolysers · Haber-Bosch 60 t NH₃/day
WHAT'S AT STAKE
Energy decides your margin, your right to sell and your uptime.
01
Energy is a margin wrecker, or a line item you control.
Energy is one of your biggest variable costs, yet it is metered per site at best. Without data per process and per shift, you can't tell what drives the bill or what to fix first.
02
Decarbonisation rules are tightening. Do you have the data?
CBAM declarations and customer supply-chain audits ask for emissions per tonne of product. Collecting that by hand from separate systems is slow and hard to defend.
03
Outages ruin flow and economics. Most are predictable.
A tripped unit or a grid dip stops a line and spoils a batch. The warning signs are usually in the data days before. If the system is being monitored.
UNDERSTAND IT
49 GWh from the grid. 30 GWh of it just kept synthesis running overnight.
Loop attributes every kilowatt-hour to the process that used it, at 15-minute resolution. You see exactly why the plant is less green and less profitable than it was designed to be.
11.0 GWh
of solar exported at ฿2.2/kWh in the same year, because the electrolysers and H₂ buffer were full.
SEE IT
The whole plant on one screen, down to each stack
Every unit shows its live value, and problems come to you before an operator goes looking.
1
2
3
4
01
Stack trip, caught in seconds
E14 tripped at 11:52 on a cell-voltage deviation. 1 MW of green capacity is flagged before anyone opens a log.
02
Surplus sold too cheap
9.7 MW exported at ฿2.2/kWh while the H₂ buffer still had room to store it.
03
Room to increase production
The buffer is filling, so the Haber-Bosch loop can safely run at 100%.
04
A failure on its way
Air-compressor vibration rose 0.4 mm/s in 3 days, now close to its 7.1 mm/s trip limit.
DECIDE IT
Evaluate options based on data and potential future outcomes
Loop simulates each option based on data from your own devices, making truly data-driven decisions possible
Today
Baseload synthesis 50–92% · electrolysers on grid at night
A · Follow the sun
Flexible synthesis 25–100% · no grid electrolysis at night
B · Hybrid
Recommended
Flexible synthesis + 20 t H₂ buffer + stack maintenance
C · Maximum output
Baseload 100% + 6 MW more electrolysers
12,100
t NH₃ / yr
Baseline
Green ammonia
Grid-based ammonia
GREEN SHARE
61%
GRID IMPORT
49 GWh
INVESTMENT
—
VERDICT
Where you are today
REPORT IT
Compliance data that collects itself
CO₂ PER TONNE OF AMMONIA
0.85 t
vs ≈ 2.4 t for grey ammonia, traced hour by hour
CBAM declarations
Embedded emissions per tonne of product, calculated from metered data and ready for your EU importers.
Scope 1 & 2 and customer audits
Energy and emissions per site, line and product for ESG reports and supply-chain questionnaires.
Green product certification
Hourly matching of renewable power to production: the evidence green hydrogen and ammonia schemes ask for.
Find the fastest payback in your plant
Book a demo
Legal Notice · Privacy Policy